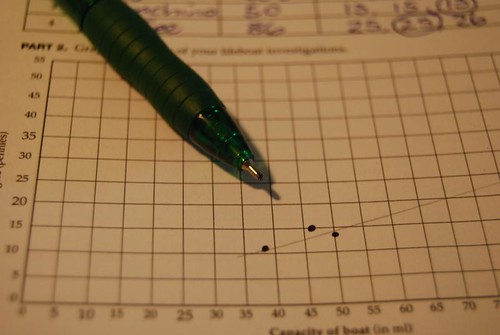
Now that we’ve learned about charts and graphs, we’re going to look at another math skill, coordinate graphing, which can help with charts. Please do the following activities:
Photo Credit: 365/245 from teachingsagittarian on Flickr
Now that we’ve learned about charts and graphs, we’re going to look at another math skill, coordinate graphing, which can help with charts. Please do the following activities:
Photo Credit: 365/245 from teachingsagittarian on Flickr
Go to create a graph here:
http://nces.ed.gov/nceskids/createAgraph/default.aspx?ID=2a5fd36948724938a29ca284a5b962d5
and make a graph with some of the data from the tape lessons we did before. Make sure you do two things:
Thanks and good luck!
Look at your comment from last time. Click on the Reply button below your comment, and tell me which roll is cheaper based on unit price.
Remember the formula for unit pricing:
Please tell me the unit price for each of these rolls of tape. Send you answer as a comment below.
 |
 |
|
10 yards for $2.39 |
60 yards for $6.79 |